


Human resources analytics uses people data to solve business problems and make smarter, faster decisions.
It's about ditching guesswork and finding answers to questions like, 'Which hiring source brings us the best engineers?' or 'Are we about to lose our top performers?'.
By digging into the data you already have, you transform the People function from a reactive support team into a strategic partner that drives growth.
Why People Analytics Matters Now More Than Ever
For too long, People teams in fast-growing companies relied on gut feelings. As your startup scales, intuition alone won’t cut it.
You need an evidence-based way to figure out what’s working, what isn’t, and where to invest your limited time and budget. Human resources analytics becomes your secret weapon here.
It gives you the hard proof needed to build a business case for new initiatives, like a leadership development program or a compensation overhaul. When you connect people programs to business outcomes like revenue growth or lower costs, you earn a voice at the leadership table.
Moving from Guesswork to Evidence
Building a data-driven People function is a fundamental shift. Instead of guessing why employee turnover is creeping up, you can slice the data to see if the problem is concentrated in a specific team, tenure bracket, or with a certain manager. This allows for targeted, effective solutions.
This analytical approach is the backbone of any strong talent management system. The field is evolving rapidly, with new intelligent automation use cases in HR completely reshaping how modern teams work. By embracing analytics, you start building a system that can proactively spot risks and highlight opportunities.
For example, you might uncover insights like:
Engineering hires from employee referrals ramp up 30% faster than those from job boards.
Employees who don't have a meaningful career conversation in their first six months are twice as likely to leave.
Teams with higher engagement scores consistently smash their quarterly sales targets.
Data helps you tell a story. It’s about building a compelling narrative that shows leadership exactly how people initiatives impact the bottom line.
This isn’t about becoming a data scientist overnight. It’s about adopting a mindset of curiosity and using simple tools to find answers hidden in your data. You move from just managing HR processes to strategically shaping the organisation.
You can learn more about this strategic approach in our complete guide to what is talent management.
Your First HR Analytics Project From Scratch
Jumping into HR analytics can feel like you need a data science degree and a massive budget. Good news: you don't. The secret is to start small, solve a genuine problem, and get a quick win that shows everyone its value.
Your first project needs to be ruthlessly focused. Don't try to boil the ocean by analysing everything at once. Pick one high-impact, nagging question that leadership is already asking.
A fantastic place to start is with early turnover. Why are great people leaving within their first year? It’s a costly problem that every founder and leader feels acutely.
Finding Your Question and Your Data
Once you’ve settled on the business problem, sharpen it into a specific, answerable question. A vague statement like "turnover is high" doesn't give you a clear direction.
A sharper question is: "Are our new sales hires in the London office leaving at a higher rate in their first six months than our other teams?".
This specificity makes it easier to figure out what data you need. You’re hunting for a few key data points that almost certainly already exist in your systems.
Start by pulling simple reports from your:
HRIS (Human Resources Information System): Your source of truth for employee data like start and end dates, department, manager, and location.
ATS (Applicant Tracking System): Holds a goldmine of hiring data, like the source of a hire (referral, job board) and time-to-hire metrics.
Exit Interview Notes: These qualitative notes are crucial. They give you the why behind the numbers, explaining the human story of why people are leaving.
This simple flow from a clear question to the right data unlocks powerful insights.
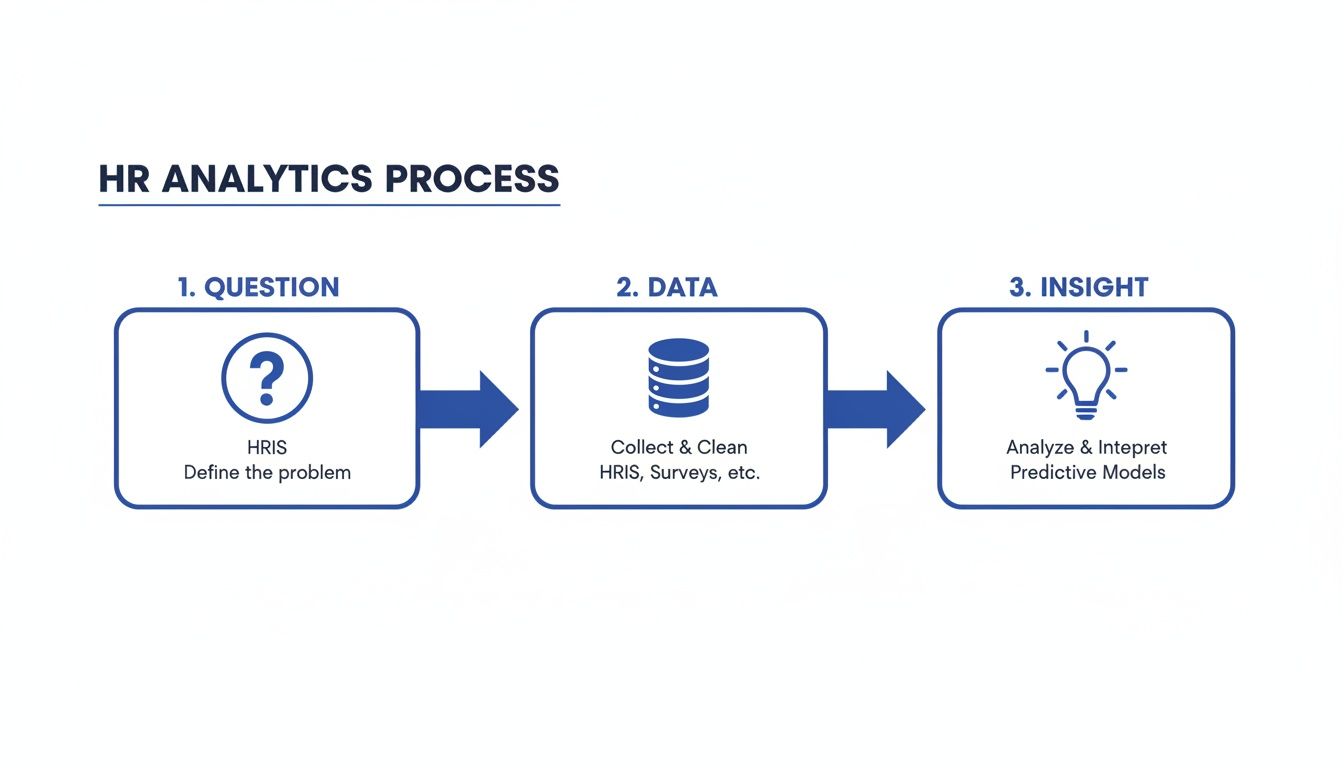
As the diagram shows, analytics is a straightforward path from curiosity to clarity.
The Quick-Win Analytics Framework
With your question defined and data in hand, it's time for the analysis. You don't need advanced statistical software. A simple spreadsheet is your best friend here.
Lay out your data and start looking for patterns. For our turnover example, create columns for employee name, start date, end date, tenure (in months), department, manager, and location.
Then, filter and sort the data to test your hypothesis.
Filter for everyone who left within 12 months.
Sort by department. Is there a spike in one area?
Sort by manager. Does one leader have a much higher rate of early leavers?
Now, look at the exit notes for that specific group. Are common themes jumping out?
The goal of your first project isn't to achieve statistical perfection. It's to find a clear, directionally correct insight that the business can act on immediately.
When you find a pattern—for instance, 70% of early leavers in the sales team were hired from a single job board and all mentioned poor onboarding in their exit interviews—you've struck gold. That's your insight.
This single finding is incredibly powerful. It’s a tangible result you can take straight to leadership. It points towards a clear solution, like fixing the sales onboarding process or re-evaluating that hiring channel. For more on connecting your findings to business value, check out our guide on proving the ROI on your people initiatives.
By starting small and delivering a concrete win, you build credibility and momentum. You prove that HR analytics is a practical tool for making the business better.
The Core People Metrics That Actually Drive Growth
Forget overwhelming dashboards with dozens of charts. When you're growing fast, you only need to track a handful of core metrics to get a pulse on your people operations. Focusing on these vital signs helps you avoid analysis paralysis and actually do something with the data.
Think of these metrics as your early warning system. They help you spot problems before they blow up and highlight opportunities to double down on what’s working. Good people analytics is about clarity, not complexity.
We'll break these essential metrics down across the three key stages of the employee journey: recruiting, engagement, and retention.
Recruiting Funnel Health
Your ability to attract and hire brilliant people is a direct predictor of your company’s future success. These metrics tell you how efficient and effective your hiring machine really is — and where it’s quietly leaking time, money, and momentum.
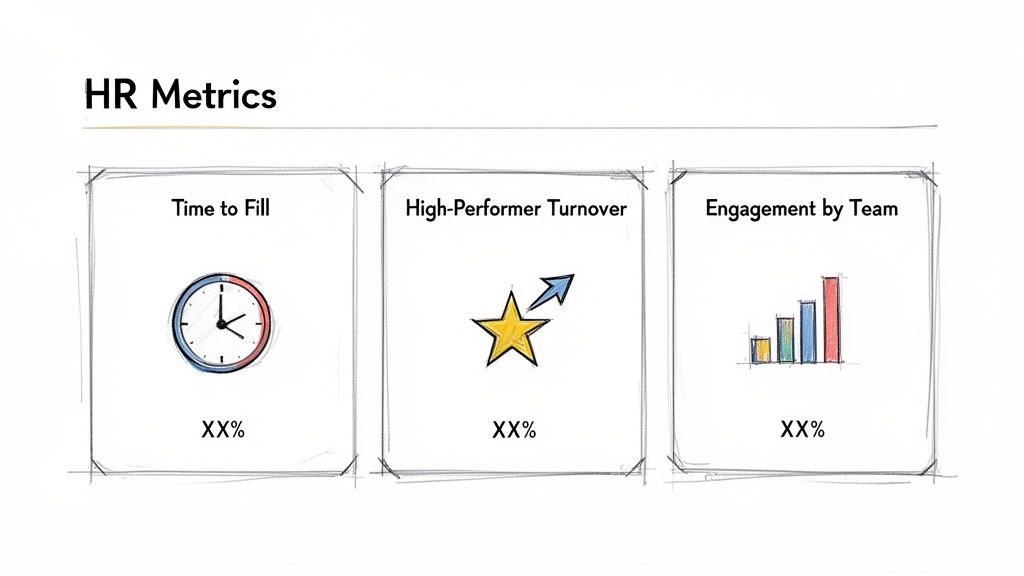
Time to Fill
The number of calendar days from when a job is opened to when a candidate accepts the offer. It’s a critical measure of hiring speed. A long Time to Fill usually means lost productivity, overloaded teams, and top candidates getting snapped up by competitors while you’re still “aligning.”
Time to Hire (the modern upgrade)
Time from first candidate touch (application, outreach, referral intro) → offer accepted.
This strips away noise and tells you how fast your actual decision-making process moves once the funnel starts.
High Time to Fill + normal Time to Hire = you’re not sourcing enough
High Time to Hire = your process is slow, unclear, or overly political
Stage Conversion Rates (your funnel truth serum)
The % of candidates that move through each step:
Apply → Screen → Interview → Final → Offer → Accept
This shows exactly where your hiring machine is failing. If candidates drop after the Hiring Manager round, the issue is usually one of these:
unclear bar
weak interview quality
role not compelling in reality
the candidate experience is messy or disorganised
Offer Acceptance Rate
Calculated as:
(Offers Accepted / Offers Extended) × 100
This metric reflects your employer brand, candidate experience, compensation competitiveness, and trust in leadership. A low number isn’t “bad luck” — it’s a signal that something is broken.
Candidate Experience Score (modern must-have)
Run a lightweight post-process pulse survey. Even one question works:
“How would you rate the overall experience?”
Candidate experience is a compounding asset. Great experiences create advocates (even from people you reject). Bad experiences create reputational drag you won’t feel until it’s too late.
Source of Hire Quality
This metric is pure gold. It tells you which channels actually produce your best people — not just the most applicants.
You do this by connecting ATS data (source) with HRIS performance outcomes 6–12 months later.
If 70% of your top performers came from referrals, your strategy becomes obvious: stop spending on low-quality channels and invest in referrals like your future depends on it (because it does).
Quality of Hire (QoH) (leadership-grade)
“Quality of Hire” is what stops you optimising for volume and starts you optimising for impact.
A practical QoH model blends signals like:
performance at 6 and 12 months
retention at 12 months
time to productivity
hiring manager satisfaction (“would you rehire them?”)
Hiring fast is nice. Hiring the right people is the multiplier.
Hiring Manager Efficiency (the hidden bottleneck metric)
Track hiring manager behaviour like a real operational system:
time to submit feedback
interview-to-offer ratio
offer declines by team/manager
number of “late-stage changes” to the role
Most “we can’t hire” problems are actually “the hiring manager is the bottleneck.”
Team Engagement and Productivity
Once people are in the door, you need to know whether they’re engaged and set up to do their best work. Engagement is not fluff — it’s a lead indicator of retention, performance, and execution speed.
Engagement is basically this:
Do people feel connected, motivated, supported — and clear on what winning looks like?
Here’s what to keep an eye on:
eNPS (Employee Net Promoter Score)
Based on:
“On a scale of 0–10, how likely are you to recommend this company as a great place to work?”
It gives you a fast snapshot of sentiment. But the real value comes from slicing the data by:
team
function
manager
tenure band
location / timezone
A healthy average can hide a totally broken pocket.
Engagement by Team
Company-wide engagement scores can be dangerously comforting. Team-level engagement is where the real story lives.
Tracking engagement at the team level tells you:
which managers are building high-performing environments
which teams are quietly burning out
where you need support, coaching, or leadership change (before it becomes attrition)
Absenteeism Rate
An increase in unplanned absences on a specific team can be an early signal of burnout, stress, or low morale. It’s a simple metric — and often the first visible crack in the system.
Burnout Risk Signals (modern and practical)
Burnout is rarely a surprise if you’re paying attention.
Early indicators often look like:
sudden drop in engagement responses
spikes in sick days
after-hours work becoming “normal”
increasing conflict / tension inside teams
performance declines from previously strong people
You don’t need perfect data — you need early warning.
Time to Productivity / Time to Impact (your onboarding scorecard)
How long it takes a new hire to deliver meaningful value.
This tells you whether onboarding is working or whether people are being thrown into the deep end and expected to swim.
When your Time to Productivity drops, you’re scaling properly.
When it grows, you’re hiring into chaos.
Manager Effectiveness (the highest ROI metric in People)
Managers are the operating system of performance.
Track manager effectiveness through:
engagement by manager
retention by manager
internal mobility rates by manager (are people growing?)
simple upward feedback: “My manager helps me succeed”
If you want one metric that predicts retention, performance and culture — this is it.
Internal Mobility Rate (the growth engine metric)
The % of roles filled through promotions, transfers or internal moves.
A strong internal mobility rate means:
people are growing
you’re building leadership depth
you’re reducing external hiring cost
the organisation is compounding capability
It’s one of the clearest signs your company is becoming a talent factory.
Retention and Turnover Analysis
Losing great people is one of the biggest costs for any startup — financially and operationally. Smart retention analysis helps you understand not just how many people are leaving, but who is leaving, when, and why.
Overall Turnover Rate
Calculated as:
(Number of Leavers in a Period / Average Headcount in Period) × 100
This is your baseline. It only becomes useful when you segment it.
Voluntary vs Involuntary Turnover (essential split)
Voluntary attrition is your real signal. It reflects:
manager quality
growth opportunities
clarity of role and expectations
culture health
workload sustainability
If voluntary attrition rises, your internal talent market is failing.
High-Performer Turnover Rate
This is the metric that should keep founders up at night.
Losing a top performer can derail delivery, crush momentum, and create “second-order attrition” (others leave because they lost trust in the direction).
If high-performer turnover is higher than overall turnover, you have a serious retention problem — or a serious leadership problem.
Regrettable Attrition Rate (modern and brutally honest)
Not all attrition is equal.
Regrettable attrition measures the % of leavers you genuinely didn’t want to lose. This is the number that predicts:
execution risk
customer risk
manager instability
delivery timelines slipping
First-Year Turnover (New Hire Attrition)
% of new hires who leave within their first 12 months.
High first-year attrition almost always means one (or more) of these is true:
your hiring process is selecting the wrong people
your onboarding is weak
the job reality doesn’t match the sales pitch
managers aren’t setting people up to succeed
It’s expensive, demoralising, and entirely fixable if you treat it seriously.
Exit Reasons by Theme (turn anecdotes into data)
Exit interviews are useless unless you categorise them consistently over time.
Track reasons using themes like:
manager relationship
compensation
workload / burnout
lack of growth
role mismatch
values / culture gap
Patterns emerge fast — and once you can see the pattern, you can fix the system.
Modern “People ROI” Metrics (The New Layer Most Startups Are Missing)
This is where People analytics stops being “HR reporting” and becomes business strategy. These metrics connect talent to value — and they give you the language leadership actually responds to.
Employee Lifetime Value (ELTV) (Peerful-style calculation)
This is the people equivalent of customer LTV: it helps you quantify the return you get from investing in employees over time.
The Peerful-style ELTV focuses on profit per $1 invested in employee cost, multiplied by average tenure.
Here’s the formula:
ELTV = (Profit per $1 of Employee Cost) × Average Tenure
Where:
Profit per $1 of Employee Cost = (Value Generated − Total Employee Cost) ÷ Total Employee Cost
And Total Employee Cost includes:
salary
benefits
equity
This creates a metric leaders instantly understand:
how much value you get back for every $1 invested in people — over the average lifespan of employment.
This is why ELTV is so powerful: it makes retention, ramp time, and manager effectiveness measurable in financial terms.
Cost of Attrition (the “this is real money” metric)
Attrition isn’t just “sad” — it’s expensive.
A practical cost of attrition estimate includes:
recruiting + sourcing cost
time cost (screening, interviews, decision time)
lost productivity while the role is vacant
ramp time for the replacement
team drag (context loss + workload increase)
Once you quantify attrition, suddenly retention becomes one of the most rational investments you can make.
Ramp Efficiency (execution speed metric)
Compare expected ramp time vs actual ramp time per role/team.
This tells you whether enablement systems are working — or whether your company is hiring people into chaos and hoping for magic.
Organisational Load Index (scale pain detector)
As companies grow, the real killer isn’t headcount cost — it’s friction.
Track signals like:
meeting hours per person
time spent on alignment vs execution
number of dependencies per project
tool/process sprawl
High org load creates the worst scaling outcome: a bigger company that moves slower.
Skill Coverage Ratio (capability planning metric)
Headcount tells you how many people you have. Skill coverage tells you whether you can actually win.
Example:
“We need 4 senior product engineers to ship this roadmap. We have 1.”
This metric helps you plan hiring around reality, not hope.
Succession Coverage / “Bus Factor” (resilience metric)
How many critical roles have:
no backup
one backup
multiple backups
This is how you spot single points of failure before they leave and everything catches fire.
How to Turn Raw Data Into Actionable Insights
Collecting data is one thing; finding the story hidden inside the numbers is the real challenge in HR analytics. On its own, raw data is just noise. Your job is to cut through that noise and find a clear signal that leadership can act on.
This is not about needing a PhD in statistics or expensive software. It’s about asking the right questions and slicing your data in simple ways to get to the root of a problem. Think of yourself as a detective piecing together clues.
Let's walk through a real-world scenario. Imagine your company's overall turnover rate is creeping up to 20%. That’s the high-level metric, the symptom. It tells you nothing about why it's happening or what to do about it. The magic happens when you start digging.

From Symptom to Diagnosis: A Retention Deep Dive
To get to the "so what?" behind that 20% figure, you need to segment your data. Break down your main dataset into smaller, specific groups to see if any patterns jump out. It’s the fastest way to go from a vague problem to a solvable one.
You can start by asking a series of focused questions, using data from your HRIS:
Is this a tenure problem? Split your leavers by how long they were with the company. You might find that 60% of all turnover happens within the first nine months. Instantly, your focus shifts from a general retention issue to a specific onboarding and early-life experience problem.
Is it a departmental problem? Next, take that first-year turnover and break it down by department. Perhaps you discover the engineering team has a shocking first-year turnover of 35%, while every other team is below 10%. Now your problem is even more concentrated.
Is it a manager problem? Let's go one level deeper. Within that engineering department, look at turnover by manager. You might see that one specific manager has lost 80% of their new hires in the last year, while the other engineering managers have lost none. You've just hit the bullseye.
This simple process of segmentation took you from "our turnover is 20%" to "we have a critical retention issue with new hires under one particular engineering manager". This is what turning data into insight looks like.
Presenting Your Findings to Inspire Action
Once you've found your insight, how you communicate it is everything. Don’t just walk into a leadership meeting and slap a spreadsheet on the table. Tell a compelling story that connects your findings directly to business impact.
Your role here is to be a strategic advisor, not just a data reporter. Frame your findings as a narrative with clear business consequences and a proposed solution.
A powerful way to frame this is: "The data tells us we aren't facing a company-wide turnover problem. We have a highly targeted issue within a single team that's costing us an estimated £200k a year in rehiring costs and lost productivity. I have a plan to address this with targeted coaching and support for the manager involved.".
This kind of statement gets attention. It’s focused, it quantifies the business pain, and it offers a clear path forward. If you want to get more advanced, you can learn how to interpret a correlation matrix to find less obvious relationships in your data. And for practical help, our list of essential tools for startup people leaders can give you the right kit for the job.
By following this process, you shift from reporting what happened to influencing what happens next. You build credibility and show everyone that a data-driven People function is an engine for growth.
Common Traps in People Analytics and How to Avoid Them
Venturing into people analytics is a huge step forward, but it's easy to stumble. Well-intentioned projects often fizzle out by falling into predictable traps. Here is your field guide to sidestepping those mistakes from the start.
The biggest pitfall is chasing metrics that don’t matter to the business. It’s tempting to track dozens of data points, but if you can't connect your work to a core business outcome like revenue or cost savings, you'll lose your audience. Leadership cares about business results, not HR metrics.
Before you kick off any project, ask yourself: "If this metric goes up or down, who outside of HR cares and why?". This forces you to link your people analytics work to a tangible business pain point.
Getting Paralysed by Imperfect Data
Another common trap is waiting for the perfect, clean dataset. In a fast-growing startup, your data will never be perfect. You’ll have gaps in your HRIS and inconsistent formatting in spreadsheets. Do not let this stop you.
The goal isn't statistical perfection; it's directional insight. You don’t need a flawless dataset to discover that 80% of your early turnover is concentrated under a single manager. Start with the data you have, acknowledge its limitations, and focus on finding clear patterns that are strong enough to act on.
Good enough data that leads to a decision today is infinitely more valuable than perfect data that arrives too late to matter. Progress beats perfection every time.
Overlooking Privacy and Trust
The moment you start analysing people data, you become a custodian of sensitive information. A huge mistake is to dive into the numbers without first establishing clear ethical guidelines and communicating what you're doing. Employees will be wary if they feel like they’re being secretly monitored.
You have to be transparent about what you are measuring, why you are measuring it, and how the data will be used. Your focus should always be on improving systems and processes, not on targeting individuals.
To build and maintain trust, follow these simple rules:
Anonymise Data: When analysing trends in engagement or wellbeing, always aggregate and anonymise the data. Focus on teams and departments, never individuals.
Communicate Your Purpose: Clearly explain that the goal of your analytics work is to spot and fix systemic problems, like a broken onboarding process. It’s about making work better for everyone.
Establish Clear Guardrails: Define exactly who has access to sensitive data and for what purpose. Make sure you are fully compliant with privacy regulations like GDPR.
By steering clear of these traps, you’ll keep your analytics work on track and build a sustainable, trusted data culture. This ensures your efforts are effective and responsible.
Where HR Analytics is Headed in UK Startups
The game is changing for UK startups. HR analytics is no longer a "big company" luxury; it’s a core skill for any ambitious scale-up. Staying ahead means looking at where the smartest operators are focusing their analytical firepower.
The immediate future is not about getting lost in complex predictive models. It’s about applying analytics to the real challenges UK startups face today. This means getting data-driven answers to questions about hybrid work, attracting top talent in a competitive market, and preventing burnout. 'Good' is no longer just tracking turnover. It’s digging into engagement data from remote teams to see if collaboration is actually happening.
The Bar is Rising for Everyone
The adoption of people analytics is speeding up, especially among SMEs. The UK HR Analytics Market was valued at USD 184.56 million and is on track to hit USD 719.20 million by 2035, growing at a compound annual rate of 13.16%. This growth shows that data-driven HR is becoming the standard. You can read more about the UK's accelerating adoption of HR analytics if you want to dive deeper.
This shift means that what felt "advanced" a couple of years ago is quickly becoming the baseline. Startups that drag their feet on building this capability will find themselves at a major disadvantage, flying blind while their competitors make smarter, faster decisions about their people.
Practical Next Steps for People Leaders
So, what can you do to prepare? The focus should be on building foundational skills and making data a part of your weekly rhythm. It’s about building a people strategy that’s proactive, not just reacting to fires.
Here’s where to focus your energy right now:
Connect People Data to the P&L: Draw a direct line from HR metrics to the company's bottom line. Calculate the real cost of losing a high-performer—factoring in lost productivity, recruitment fees, and onboarding time—to build an undeniable business case for retention efforts.
Analyse the Hybrid Experience: Use data from engagement surveys, communication tools, and productivity platforms to get a true picture of your hybrid model. Are remote folks feeling as connected? Are specific teams struggling? The data holds the answers.
Focus on Skills, Not Just Roles: Start mapping the critical skills you have inside your organisation. As you scale, this data becomes gold for enabling internal mobility, spotting skill gaps before they become a problem, and making smarter hiring decisions.
The future of HR analytics in startups is not about buying a flashy new tool. It's about getting better at asking the right questions and using the data you already have to build a more resilient, high-performing organisation.
Frequently Asked Questions About HR Analytics
We get it. Diving into human resources analytics can feel like a mammoth task when you're already spinning multiple plates. Here are the straight-up answers to the most common questions we hear from People Leaders in the trenches.
What Tools Do I Really Need to Start?
You can get started with the tools you already use. Your first projects don’t require a flashy, expensive platform.
A simple spreadsheet is powerful enough when combined with data exports from your HRIS and Applicant Tracking System (ATS).
The most important thing is to start with a clear business question, not a complicated piece of tech. Focus on solving one specific problem. As your skills grow, you can explore dedicated analytics platforms, but never let a lack of tools stop you from starting.
How Do I Get Leadership to Care?
You get buy-in from leadership by speaking their language. That means talking about business problems, not HR metrics.
Avoid saying, "I want to track our turnover rate.". Instead, frame it as a direct solution to a business pain point.
Try this approach: "I have a hypothesis about why we're losing so many good engineers in their first year. If I'm right, solving it could save us an estimated £100k in hiring costs and lost productivity. I just need a bit of time to dig into the data.".
Start with a small, focused project that addresses something keeping your founder up at night. Deliver one clear, actionable insight that saves money or drives growth, and you'll build the credibility you need for future work.
How Much Data Is Enough to Get Insights?
You almost certainly need less data than you think. Even with a small team, you can spot powerful trends that point you in the right direction.
Prioritise the quality and relevance of your data over sheer quantity.
For instance, carefully analysing the exit interview notes from just 10-15 people who have recently left can often reveal glaring patterns. Your goal isn't to achieve statistical perfection. It's about finding directional insights that help you and your leadership team make better, more informed decisions, fast.
In the UK, small and medium-sized businesses are leading the charge in using this exact approach to gain a competitive edge. Discover more about how SMEs are driving HR analytics growth on researchandmarkets.com.
At Open Org, we build practical, no-fluff resources to help you solve your biggest people challenges. Our Content Pass gives you access to hundreds of tried-and-tested playbooks, templates, and an AI-powered coach to help you execute faster. Get the tools you need to accelerate your work.
